
Text Box
To access this screen:
-
Double click a Text Box on a plot sheet.
-
Right click a text box and select Text Box Properties.
The Text Box screen is used to format a text box plot item on a plot sheet.
The following tabs are shown:
- Text Box Properties—All editable title box properties are shown here. See below.
- Alignment—Control the alignment of text within the text box. See below.
-
Drawing Order—Used to determine at which point in the screen drawing process the current item is drawn to the screen. See Drawing Order.
Sharing Text Box Properties
Sometimes, for consistency, you want multiple plot items on the same sheet to share the same characteristics. This could be visual formatting, for example, so you can make more general changes to the appearance of your plot report without having to adjust multiple plot item properties.
To achieve this, use Share Properties. First, decide on the items that will share properties, then choose which properties to share.
Consider the following example, where two text boxes exist on a plot sheet. They both (intentionally) have different colouring and text contents, but they would look better if they were the same width:
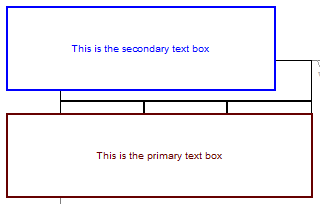
To make these text boxes (always) have the same width:
-
Display the Properties control bar.
-
Display the Plots window and the plot sheet containing the text boxes.
-
Define the extent of sharing permitted for the current project. This is done by setting the Share property on the Overlays object of the projection:
-
Display the Sheets or Project Data control bar.
-
Expand the Plots >> [Plot Sheet Name] >> [Projection Name] folders, for example:
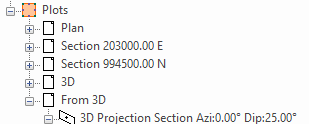
-
The projection group (regardless of whether it is a 2D or 3D projection type) will contain an Overlays entry.
-
Right-click the Overlays item and select Overlays Properties.
The Overlays screen displays.
-
Ensure the Share value is Within Sheet.
Note: You can also share text box information with other plot sheets using the Within Document option.
-
-
Select the primary text box.
The properties of the plot item display in the Properties control bar.
-
In the Properties control bar, expand the Sharing group.
-
Change Share Properties to Yes.
-
Add a unique value to Set ID. This ID is used to link text boxes on the sheet, so won't be unique for long.
-
Change the Width setting to Yes.
-
Ensure all other settings are set to No.
-
Click into the secondary text box.
-
In the Properties control bar, expand the Sharing group.
-
Change Share Properties to Yes.
-
Add a unique value to Set ID. This ID is used to link text boxes on the sheet, so won't be unique for long.
-
Change the Width setting to Yes.
Both text boxes are now the same width, and adjusting one will automatically adjust the other.
Text Box Properties
The following settings can be applied to text boxes using the Text Box screen:
| Text Box Properties Tab | |
| Fit Text to Box | Expand or contract the text in the text box to fill all available space. If this is checked, Fit Box to Text cannot be checked (see below). |
| Fit Box to Text | Snap the text box to fit the existing text size. This can be used instead of Fit Text to Box (see above). |
| Width | Specify the width of the text box in mm. You can use the spin buttons or type a value directly into the field. |
| Height | Set the height of the text box in mm. |
| Font... | Displays a font picker to set the font face of the text contained within the current text box. |
| Colour | Set the colour of all text box elements, including borders and text. |
| Opaque | Determines whether the unfilled parts of the text box are opaque or transparent. |
| Border | Toggle the display of the check box border. |
| Strikeout | Toggle the use of strikethrough font within the text box. |
| Underline | Toggle the use of font underlining. |
| Contents |
The text to be displayed. Tip: Press CTRL and ENTER to add a line feed. |
| Alignment Tab | |
| Horizontal | Choose Left, Right or Centre alignment. |
| Vertical | Choose Top, Middle or Bottom alignment. |
Note: A complete list of text box plot item properties is accessible using the Properties control bar.
Related topics and activities